What Is Website Analytics: A 2026 Guide
Nick · Published 13 August 2026
You sent a pitch deck last week and the inbox is still quiet. No reply, no questions, no sign anyone opened slide 3, or maybe they opened it and left after the cover. That uncertainty is exactly why website analytics exists, it turns silence into behaviour you can read.
Website analytics is not a vanity counter. It's a way to measure how people find, use, and convert on a site, so you can understand whether the page did its job. In practice, that means looking at the trail a visitor leaves, then asking what it says about attention, friction, and intent.
Table of Contents
- Why a Founder's Silence Tells You What Analytics Is
- Defining Website Analytics in Plain English
- The Core Metrics That Matter
- How Behaviour Data Is Actually Collected
- Setting Up a Site to Be Measured Properly
- The Privacy Trade-Off in How You Identify Readers
- Where Page-Level Document Analytics Fits In
- Connecting Page-Level Events to GA4
Why a Founder's Silence Tells You What Analytics Is
A founder sends a pitch deck to a dozen investors and hears nothing back. The hard question isn't just, “Did they open it?” It's, “Did they stop at the overview, skim the traction slide, or reach the financials and decide to pass?”
That's the true value of analytics, it reads behaviour, not just volume. A file with many opens and no follow-up might still have been ignored in the pages that matter. A file with fewer opens and repeated return visits can be more useful than a document that got broad exposure but no genuine attention.
What silence can reveal
A dashboard can't tell you why someone stayed or left, but it can show the shape of the journey. Did the reader make it through the deck, the proposal, or the brochure? Did they come back later, or vanish after page one?
Practical rule: treat analytics as evidence of attention, not proof of interest. A reader who spends time on a page may be engaged, confused, or simply interrupted.
That's why the useful question is rarely, “How many views did I get?” It's more often, “What happened after the click?” For a founder, that might mean investor follow-up. For a freelancer, it might mean whether a proposal got a second look. For a marketer, it might mean whether a brochure led to a form fill.
There's also a privacy question hiding inside that silence. Do you need to know who the person is, or do you only need to know what they did? That tension sits at the centre of modern analytics, especially when the content is a pitch deck, a policy file, or a client proof that shouldn't turn into a surveillance exercise.
Defining Website Analytics in Plain English
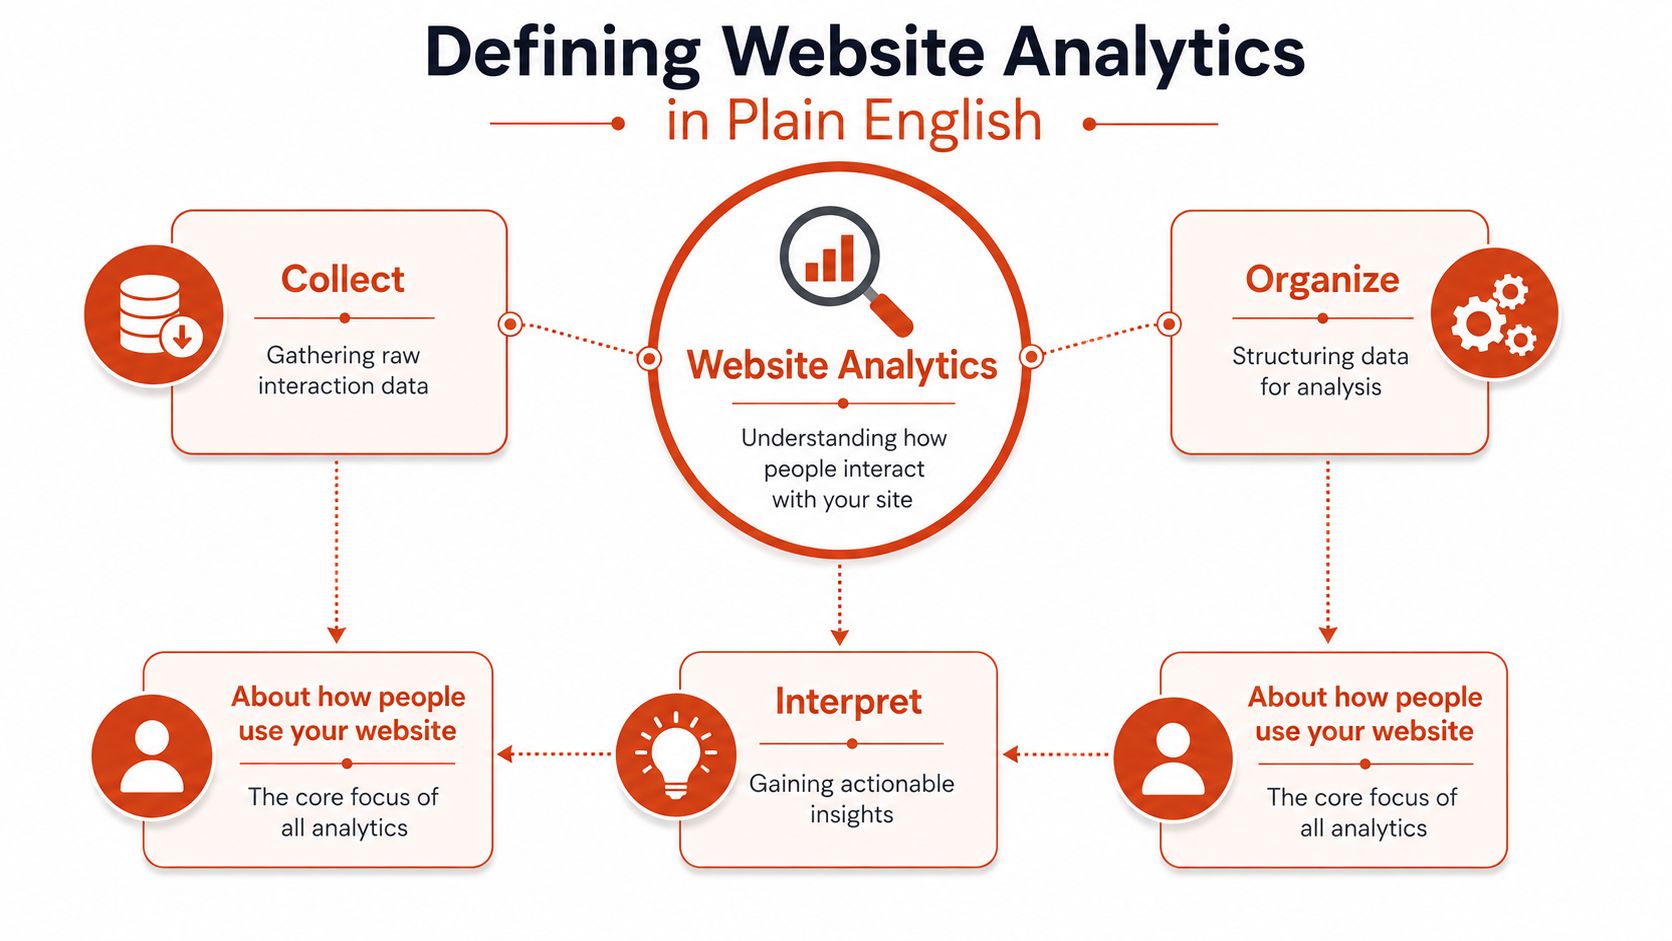
Website analytics is the practice of collecting, organizing, and interpreting data about how people use a site so you can tell whether the site is doing its job. The “job” might be a signup, a purchase, a read, a download, or getting someone to spend enough time with the content to understand it.
Three ideas usually organise the work:
- Traffic, who arrived and where they came from. A visitor who lands from search has a different context from someone who clicked a link in an email or came from another site.
- Engagement, what they did once they arrived. Time on page, pages per session, and clicks on key elements tell you whether they interacted or just bounced through.
- Conversion, whether the intended outcome happened. That could be a form submission, a booking, or a completed checkout.
A simple example helps. If a product page gets lots of pageviews, that's traffic. If visitors spend time comparing features, that's engagement. If they submit the demo form, that's conversion. The three together tell a story that one metric can't.
The modern view is broader than traffic alone. Core Web Vitals and load-speed signals now matter because performance changes what people do on the page, especially on mobile. In that sense, analytics isn't just counting visits, it's measuring the conditions that shape behaviour. For a brochure that loads slowly on a phone, the problem isn't merely technical, it affects whether the reader gets far enough to care.
The Core Metrics That Matter
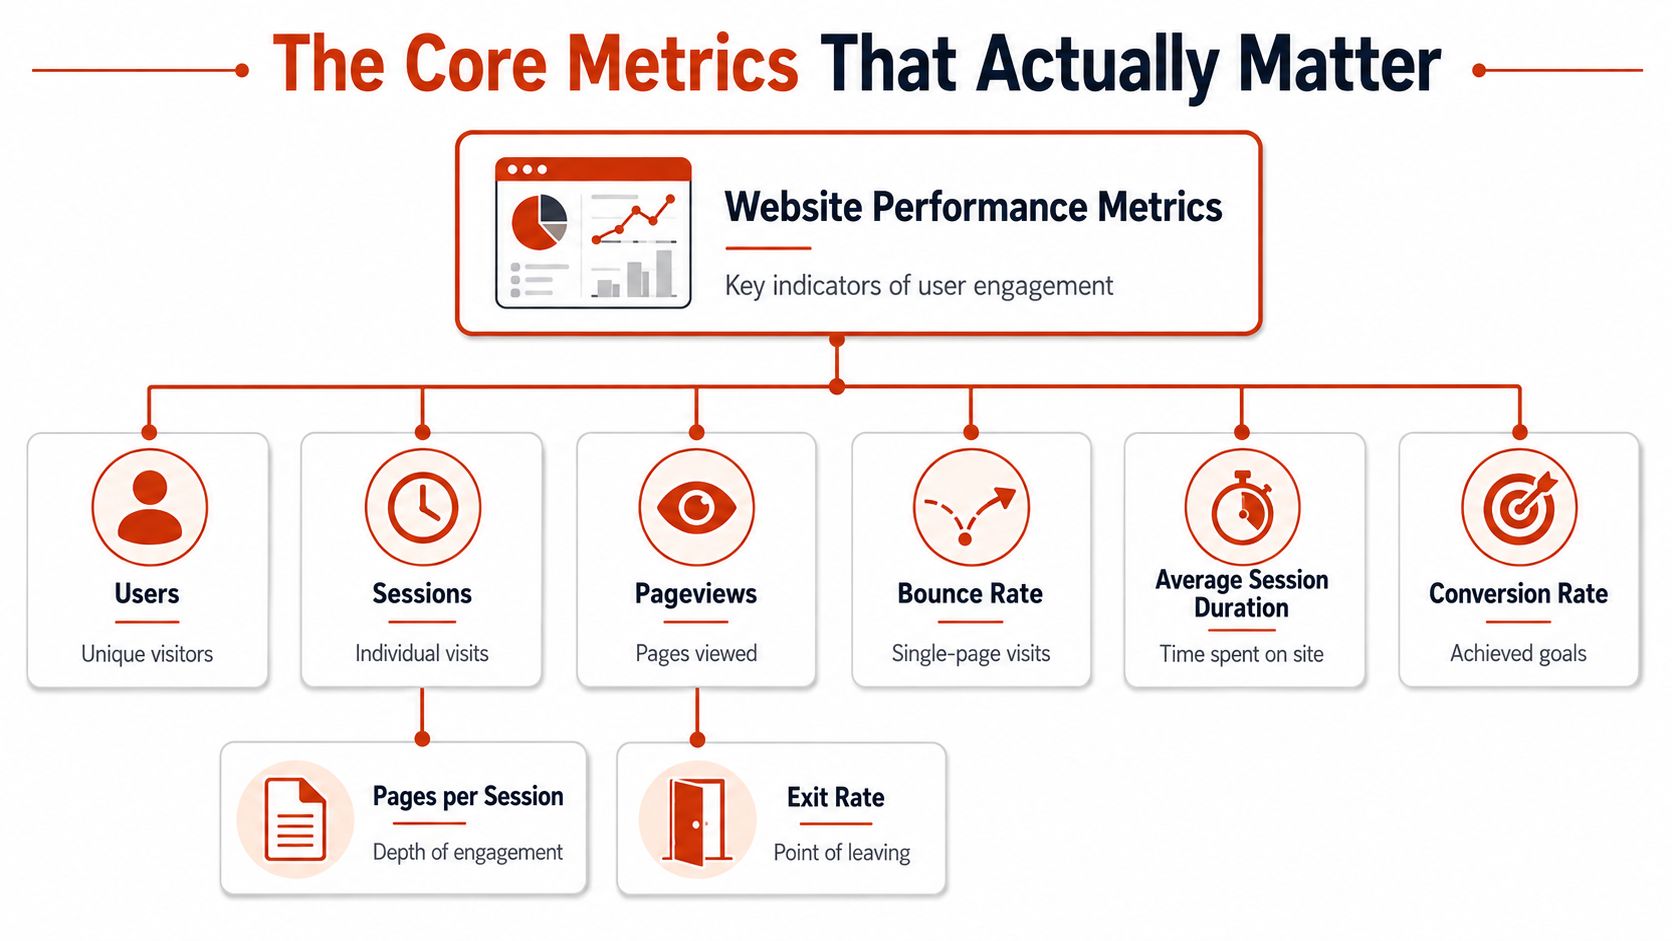
The usual terms look similar, but they answer different questions. If you read them as one blended signal, you miss the point of what the site is doing and why.
Exposure metrics tell you who saw something
Pageviews count how often a page was loaded. Unique visitors or users show how many distinct people came in. Those numbers help you understand reach, but they do not tell you whether the page held attention or prompted action.
A freelancer's proposal page can have plenty of views because a client kept forwarding it around internally. That looks encouraging until you notice there is no depth of engagement and no reply. High exposure alone does not prove the proposal landed.
Depth metrics show whether attention held
Average session duration and pages per session help you estimate how long people stayed and how much of the site they explored. A pitch deck reader who moves across several pages is showing more than a drive-by visit. A brochure viewer who leaves almost immediately may have found the wrong page, the wrong offer, or the wrong format.
Bounce rate and exit rate are easy to confuse. Bounce rate is about single-page visits, while exit rate tells you where people left. A product page with a high exit rate may be the end of a useful journey, or it may be the point where people lost confidence. The number alone does not decide that for you.
Practical rule: pair exposure with depth before you draw conclusions. A page that gets attention and produces action is a different asset from a page that gets seen.
Outcome metrics close the loop
Conversion rate is the clearest outcome measure because it shows whether the site produced the action you wanted. It matters more than reach when the main question is business effectiveness. In web analytics, that is why conversion sits beside traffic and engagement, not after them as an optional extra.
The same logic applies to document analytics. A sales deck, a proposal, and a client proof all need different readings, but in each case the point is the same, did the reader move far enough to do something useful? A page that gets seen is one thing, a page that helps a reader decide is another. That is why page-level and document-level analytics matter alongside the broader site metrics.
How Behaviour Data Is Actually Collected
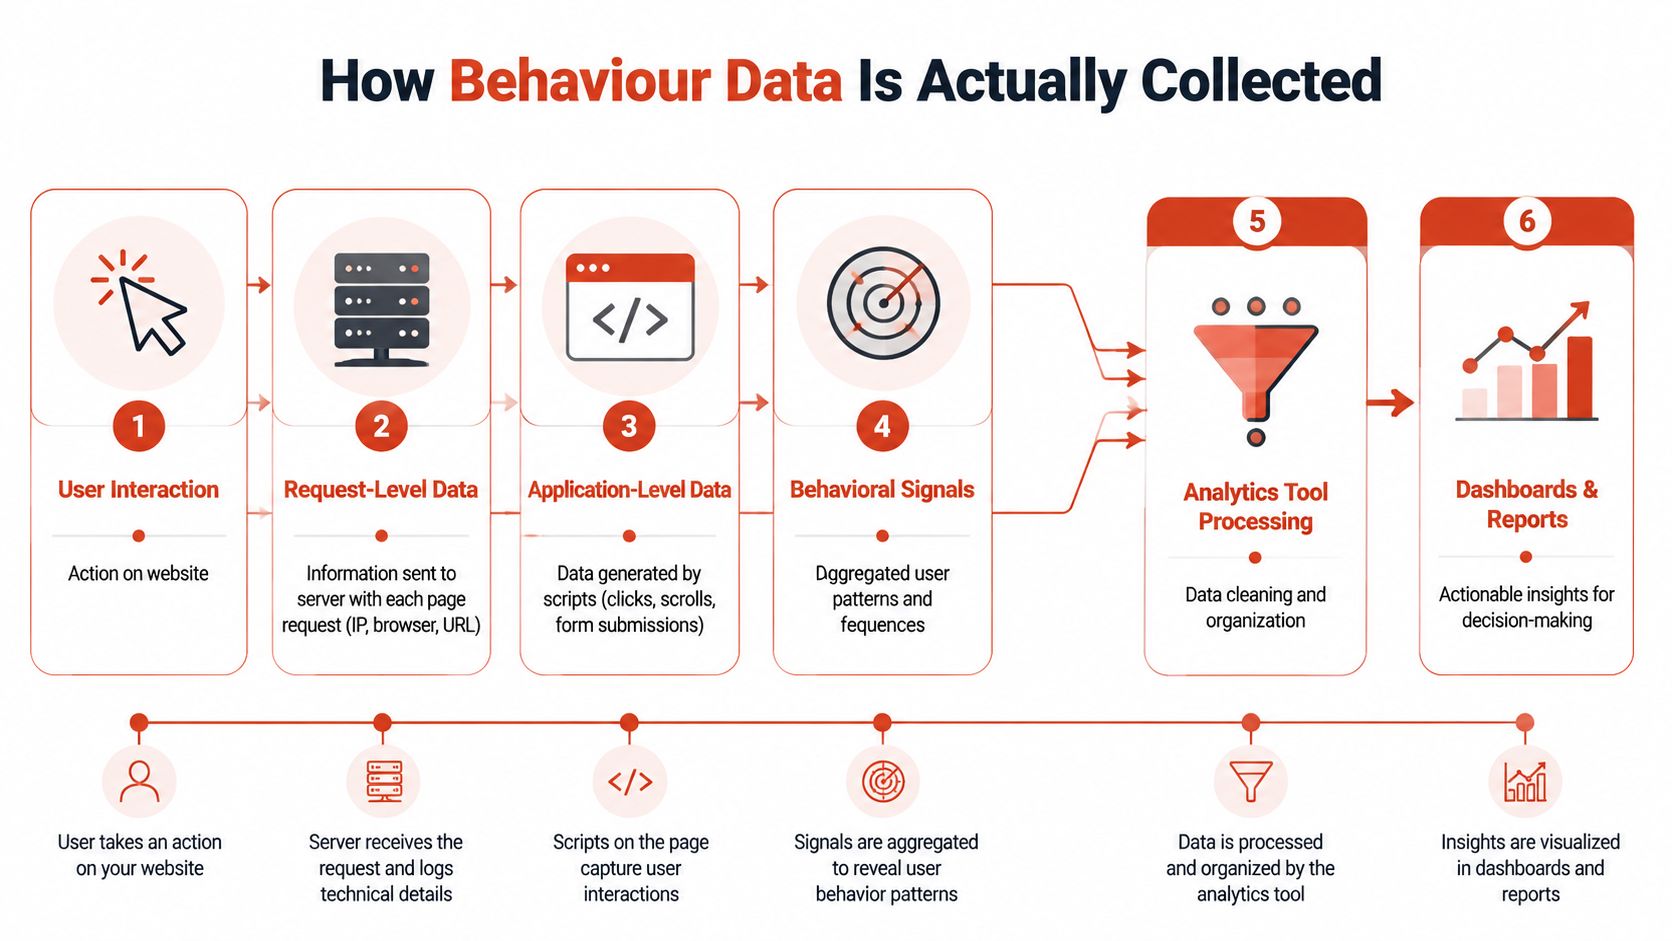
The dashboard feels neat because the messy part happens underneath it. A browser sends requests, scripts record actions, and the analytics tool turns those fragments into a usable story.
The raw signals
At the lowest level, tools work with request-level and application-level data. That includes page loads, clicks, form submissions, traffic source information, entry and exit paths, and other events captured by scripts in the page. ScienceDirect notes that web analytics systems can record the order and timing of page views, click paths, download history, visit patterns, and site traffic in near real time using JavaScript technology (ScienceDirect's overview of web analytics).
This is how a question turns into data. A marketer asks where visitors came from, and the tool reads referrers. A sales lead asks whether someone downloaded the proposal, and the tool logs the event. A content team asks where readers stop, and the path data shows the drop-off.
Sessions are reconstructed, not magical
A session is stitched together from activity. It isn't a natural object sitting in the browser waiting to be discovered. It's a measurement construct, built from timestamps, page views, and event sequences so the tool can say, “These actions belong together.”
That's why consent choices, ad blockers, and browser privacy settings can change what appears in a report. The numbers are still useful, but they're a measurement of observed behaviour, not a perfect census of every human action.
If you want the plumbing behind event collection in a document workflow, the event feed documentation in EveryPage's developer docs shows how page-level activity can be passed along in a structured way.
The modern model is event-based
Older reporting often revolved around hits and visits. Modern analytics platforms usually treat page views as one event among many, alongside clicks, submissions, and other interactions. That shift matters because it moves the report from “someone arrived” to “someone did something useful.”
Setting Up a Site to Be Measured Properly
Analytics doesn't switch on by itself. Someone has to set up the measurement stack, and when the setup is sloppy, the numbers become noisy fast.
Google's own GA4 web setup starts with a Google Analytics account, then a property, then a web data stream. The site also has to be tagged before data collection starts, and Google recommends Google Tag Manager because it makes configuration changes easier (Google Analytics web setup guide).
What the setup really does
The tag is the thing that tells the browser what to record. Without it, the tool has nothing to measure. With it, the site can send events, page views, and conversion signals into the reporting layer.
A clean setup matters more than a fancy dashboard. If a form event fires twice, the conversion count becomes unreliable. If the wrong pages are tagged, engagement looks better or worse than it really is. If consent isn't handled properly, the report becomes patchy in ways that look like traffic loss but are really tracking loss.
Privacy and setup belong together
A serious measurement stack now has to respect consent from the start. In regulated or sensitive environments, that isn't a side issue. It shapes how you collect, store, and interpret the data, especially when the content is a policy document, a contract, or a confidential pitch.
A well-tagged site can still produce less data than a poorly tagged one, because privacy settings are part of the system, not an exception to it.
That's why analysts spend so much time on implementation details. The report at the end only makes sense if the collection layer is trustworthy. Without that, you aren't reading behaviour, you're reading the side effects of bad setup.
The Privacy Trade-Off in How You Identify Readers
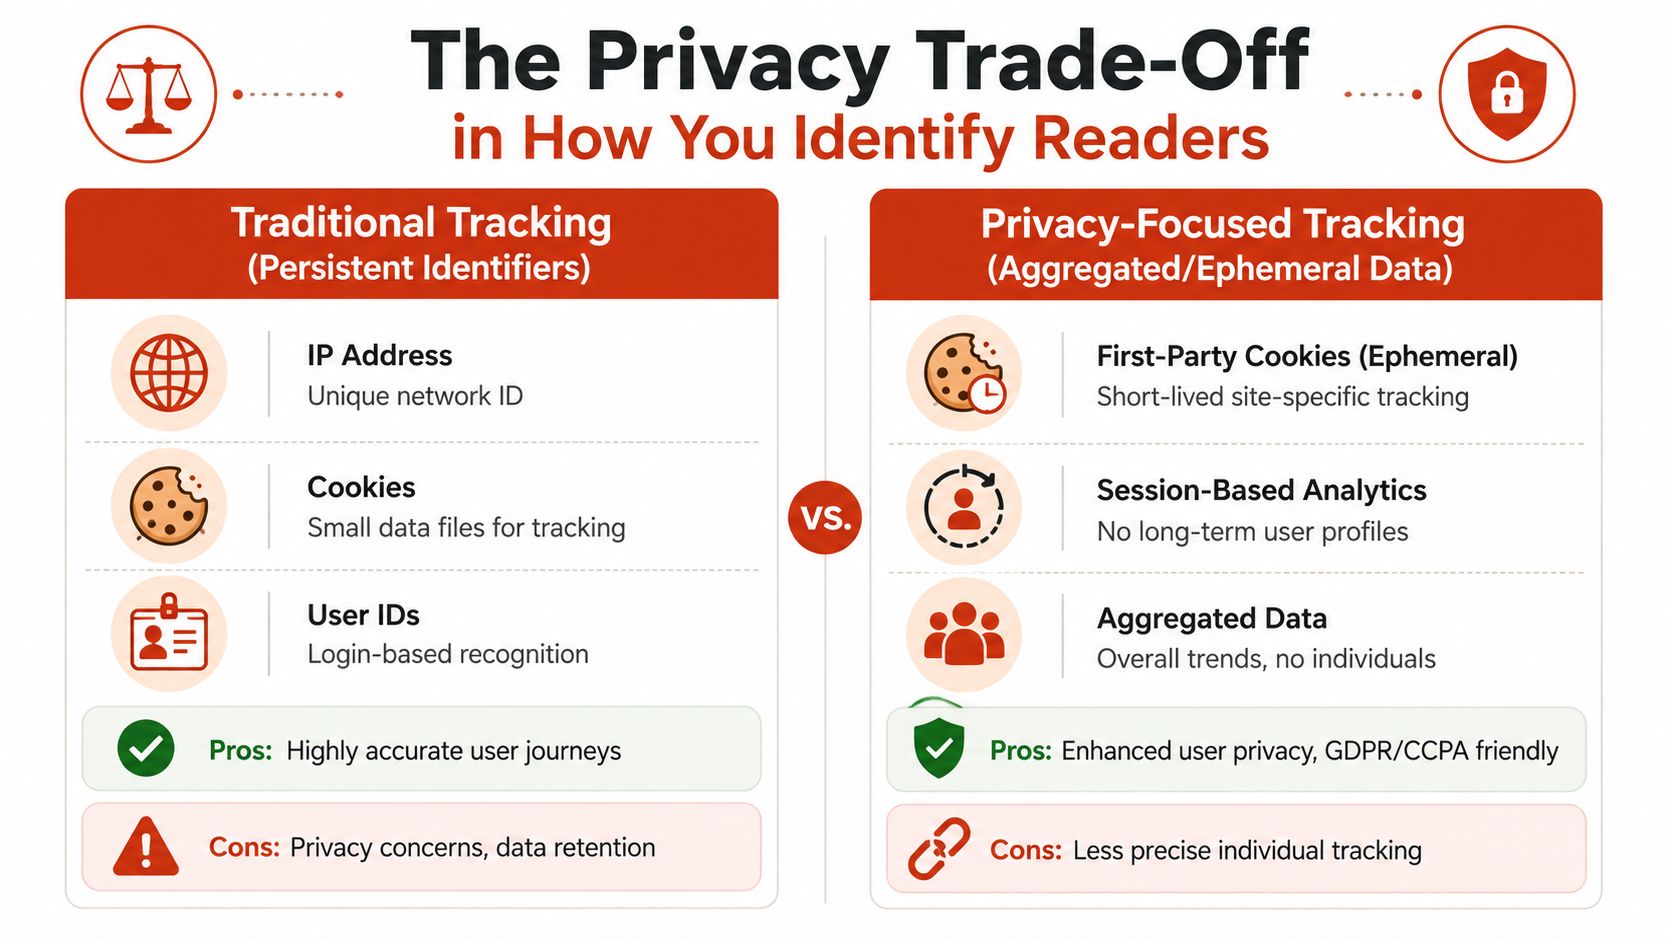
The old model of identification is blunt. Store a persistent identifier, often including the IP address, and it becomes easier to recognise return visits and stitch sessions together. That can be useful, but it also creates a bigger privacy burden.
The privacy-first approach takes a different route. Instead of keeping the raw address, the system can rely on a pseudonymous identifier, such as a salted one-way hash, so the reader can be recognised again without writing the address into the database. The trade-off is real. You gain a cleaner privacy posture, but you give up some of the ease of individual-level tracing.
Three practical scenarios
A sales proposal sent to a procurement team needs to show whether the reader came back to the pricing pages. That doesn't require a household identity, it requires a reliable engagement signal.
A photographer sharing proofs needs to know which images were revisited and which were ignored. That's a page-level question, not a personal-data question.
An HR policy document needs proof of readership without turning the process into a surveillance exercise. In that case, aggregated and pseudonymous reporting is usually more appropriate than storing more identifying information than necessary.
What this means in practice
Privacy-first analytics is not the same thing as “less useful.” It's different in what it prioritises. You can still measure views, time on page, revisits, and drop-off, but you're designing the system so the address itself never becomes the point.
That's where page-level document analytics becomes relevant. If the goal is to understand whether someone read the deck, not who they are outside that context, then a tracked document with reader privacy built in can answer the business question without pulling in more identity data than needed.
Where Page-Level Document Analytics Fits In
Website analytics tells you what happened on the site. Page-level document analytics tells you what happened inside a single shared file, page by page, which is why it reads behaviour rather than just traffic.
A pitch deck makes the difference easy to see. Site analytics might show that a visitor landed on the download page and then left. Document analytics shows whether they reached the team slide, spent time on the financials, or returned to the deck later. That is a different layer of attention, and for a founder it can be the layer that matters most because it reveals where interest grew or dropped inside the file itself.
What the document report adds
Views show whether the file opened. Time on page shows whether a page held attention. Read-through funnels show how far the reader got. Re-read rate shows which pages pulled people back. The report is useful because each metric answers a different question, and none of them should be stretched beyond that question.
A freelancer sending a proposal usually cares about a slightly different pattern. If a client spends time on the scope page but keeps returning to the pricing page, that points to the part of the conversation they want to have next. A photographer sharing proofs may care most about which spreads were revisited before selections were made. A brochure can tell a different story again, because a reader may skim the overview, pause on a service page, and then return to contact details only if the offer feels relevant.
What the document report adds is a closer look at page-by-page behaviour inside the file. That matters because site analytics can show entry and exit, while document analytics shows where attention concentrated once the file was open.
Practical rule: use site analytics to read discovery, and page-level document analytics to read depth.
This kind of reporting works well when the document itself is treated as a durable asset rather than a disposable attachment. In EveryPage, sharing does not require a reader account, and sharing the file does not require the sender to create one either. That makes it possible to upload a PDF and get a tracked link immediately, while keeping the experience light for the reader.
The other useful distinction is privacy. Page-level analytics can be built without storing reader IP addresses, which keeps the reading record useful without turning the document into a data-heavy liability. For teams handling proposals, proofs, brochures, or policy files, that difference matters because the report needs to be useful and defensible without collecting more identifying detail than the use case requires.
Connecting Page-Level Events to GA4
When document engagement sits next to website behaviour in the same reporting stack, the story gets easier to read. A sales team can see the landing page, the deck engagement, and the follow-up form in one place instead of jumping between tools.
GA4's event-based model makes this a natural fit. Page-level events from a shared PDF can be forwarded as events, so the document reads like part of the broader journey rather than a separate island of data. The important part is discipline, not volume. Send the events that answer the question, and don't double-count what the website already measured.
A simple checklist keeps the setup sane:
- Define the question first. Are you trying to see whether someone opened the file, read thoroughly, or returned?
- Pick the matching event. Forward the page-level signal that answers that question, not every possible interaction.
- Respect consent. If the user hasn't agreed to tracking, the measurement layer has to follow that choice.
- Treat the report as feedback. Use it to improve follow-up, content order, or document structure, not just to admire the dashboard.
The integration guide in EveryPage's GA4 documentation shows how share-link visits can flow into GA4, which is useful when document engagement needs to sit beside site and campaign data. EveryPage is our product, and one limitation to keep in mind is that it's built for PDF sharing and page-level readership, not as a general replacement for full web analytics suites.
For teams choosing tools, the right answer is often a combination. A site analytics platform reads traffic and conversion. A document layer reads page-by-page attention. Together, they give a clearer picture than either one alone.
If you're trying to understand how people read the files you send, EveryPage gives you page-by-page analytics, read-through tracking, and privacy-first sharing without making readers create an account. Visit EveryPage to see how tracked PDF sharing can fit alongside your website analytics stack.
See who reads your next PDF.
Try EveryPage free